How the t-value changes with data size
The t-value is a statistic that measures how far a sample mean is from the population mean relative to the sample standard deviation. It is used to perform t-tests, which are a type of hypothesis testing that compares two means or a mean and a constant.
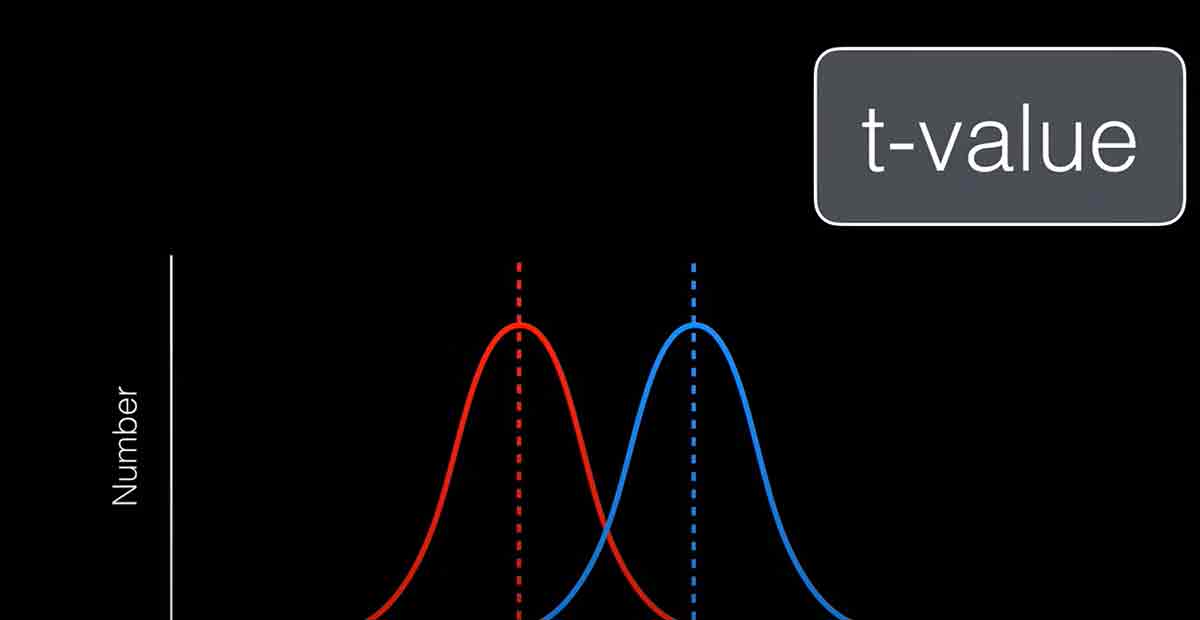
The t-distribution
The t-value follows a particular type of probability distribution called the t-distribution.
The t-distribution is like the normal distribution, but it has fatter tails. This means that it has more chances of having very high or very low values than the normal distribution.
The form of the t-distribution is determined by a factor called the degrees of freedom.
The degrees of freedom are connected to the sample size, and they show the amount of independent data points in the sample. The bigger the degrees of freedom, the more similar the t-distribution is to the normal distribution.
The effect of data size
The sample size affects the t-value in two ways: through the standard error and the degrees of freedom.
The standard error measures the sample mean’s variation around the population mean. It shows how much the sample mean changes from one sample to another.
The standard error depends on the sample size. The bigger the sample size, the smaller the standard error. A smaller standard error means that the sample mean is closer to the population mean and more accurate.
The degrees of freedom are the number of independent values in the sample. They are one less than the sample size. The degrees of freedom get bigger as the sample size gets bigger.
A larger degree of freedom means that the t-distribution is more similar to the normal distribution and has less heavy tails. This means that the t-value is less likely to have extreme values.
What determines the t-value?
The t-value is determined by the sample mean, the population mean, the sample standard deviation, and the sample size. The formula for the t-value is:
t=s/nxˉ−μ
where
the sample mean is xˉ, μ is the population mean, s is the sample standard deviation, and n is the sample size.
What affects the t-value?
The t-value depends on the sample size, the standard error, and the degrees of freedom. The sample size and the standard error have an opposite relationship, meaning that when one goes up, the other goes down.
The degree of freedom is the sample size minus one, which determines the t-distribution’s form. The bigger the degrees of freedom, the closer the t-distribution is to the normal distribution and the smaller the chance of the t-value having very high or very low values.
What is the difference between a t-test and a z-test?
A t-test and a z-test are hypothesis tests that compare the means of one or more groups. However, there are some key differences between them:
- A t-test is used when the population standard deviation is unknown, while a z-test is used when the population standard deviation is known.
- A t-test follows a t-distribution with heavier tails than a normal distribution. A z-test follows a normal distribution, which is symmetric and bell-shaped.
- A t-test requires the degrees of freedom related to the sample size to determine the shape of the t-distribution. A z-test does not need the degrees of freedom, as the normal distribution is fixed.
- A t-test uses the estimated standard error calculated from the sample standard deviation. A z-test uses the standard error calculated from the population standard deviation.
What is t-test calculator?
A t-test calculator is a tool that can help you perform different types of t-tests, such as one-sample, two-sample, or paired t-tests.
A t-test is a statistical formula that compares the means of one or more groups and tests whether they are significantly different from each other or from a hypothesized value.
There are many online t-test calculators available, such as GraphPad, Omni Calculator, Ncalculators, Social Science Statistics, and Statscalculator. Each has different features and options, such as data entry format, test type, significance level, and hypothesis direction. You should choose the one that suits your needs and preferences.
Does the T value change depending on the number of data points collected?
Yes, the T value changes depending on the number of data points collected. As the sample size increases, the T value decreases and becomes less variable.
How to interpret t-test results?
To interpret t-test results, you need to compare the p-value and the critical value of the test with your chosen significance level. The p-value is the likelihood that the variation in the averages is caused by randomness.
The critical value is the threshold the test statistic must exceed to reject the null hypothesis. The significance level is the maximum acceptable probability of making a type I error (rejecting the null hypothesis when it is true).
- You can discard the null hypothesis and say that the averages are significantly different if the p-value is smaller than the significance level or the test statistic is more meaningful than the critical value.
- Suppose the p-value is more meaningful than the significance level or the test statistic is less than the critical value. In that case, you cannot reject the null hypothesis and conclude there is no significant difference between the means.
You can also report the confidence interval for the difference between the means, which gives a range of plausible values for the true difference based on the sample data.
The lowest amount a manufacturer can pay factory workers is an example of?
Example 2: Two-sample t-test
A doctor wants to compare the effectiveness of two drugs for lowering blood pressure. He randomly assigns 50 patients to either drug A or drug B and measures their blood pressure after four weeks.
He performs a two-sample t-test with a significance level of 0.05. The null hypothesis is that the two drugs have the same mean effect on blood pressure.
The alternative hypothesis is that the two drugs have different mean effects on blood pressure.
The summary statistics for the two groups are:
Drug A: Mean = 130, Standard deviation = 10, Sample size = 25 Drug B: Mean = 125, Standard deviation = 12, Sample size = 25
The test statistic is calculated as:
t=spn11+n21xˉ1−xˉ2
where
sp=n1+n2−2(n1−1)s12+(n2−1)s22
Plugging in the values, we get:
sp=25+25−2(25−1)102+(25−1)122
sp=11.07
t=11.07251+251130−125
t=1.81
The degrees of freedom are:
df=n1+n2−2
df=25+25−2
df=48
The p-value can be found using a T Score to P Value Calculator1 with t = 1.81 and df = 48. The p-value is 0.077.
The critical value can be found using a t Critical value Calculator2 with df = 48 and a 95% confidence level. The critical value is 2.011.
Since the p-value is greater than 0.05, or the test statistic is less than the critical value, we cannot reject the null hypothesis.
We conclude that there is no significant difference between the mean effects of the two drugs on blood pressure.
The confidence interval for the difference between the means can be calculated as:
xˉ1−xˉ2±tα/2,df×spn11+n21
130−125±2.011×11.07251+251
5±6.16
[−1.16,11.16]
We are 95% confident that the true difference between the mean effects of the two drugs on blood pressure is between -1.16 and 11.16.
The conclusion
The t-value changes depending on the number of data points collected. As the sample size increases, the t-value decreases in magnitude and becomes less variable.
This is because the sample mean becomes more accurate, and the t-distribution becomes more regular. A smaller and less variable t-value means that the sample mean is more likely to be close to the population mean, and the null hypothesis is more likely to be accepted.